

Running ads without looking at metrics is like driving with your eyes closed.
You might move forward. You might even get “some results.” But you won’t know why it worked, what to change, or when you’re about to crash and burn your budget.
And here’s the part most people get wrong: you don’t need 50 metrics. You don’t need to stare at Ads Manager like it’s a stock chart.
You need 8 metrics, the ones that actually guide decisions.
This isn’t a reporting tutorial. It’s a decision guide: the numbers you check so you know what to do next, scale, pause, refresh, or fix the funnel.
The Only 8 Metrics That Actually Guide Decisions
Here’s the filter: if a metric doesn’t help you decide “scale, pause, refresh, or fix something”, it’s probably noise.
These 8 are the ones that keep you in control.
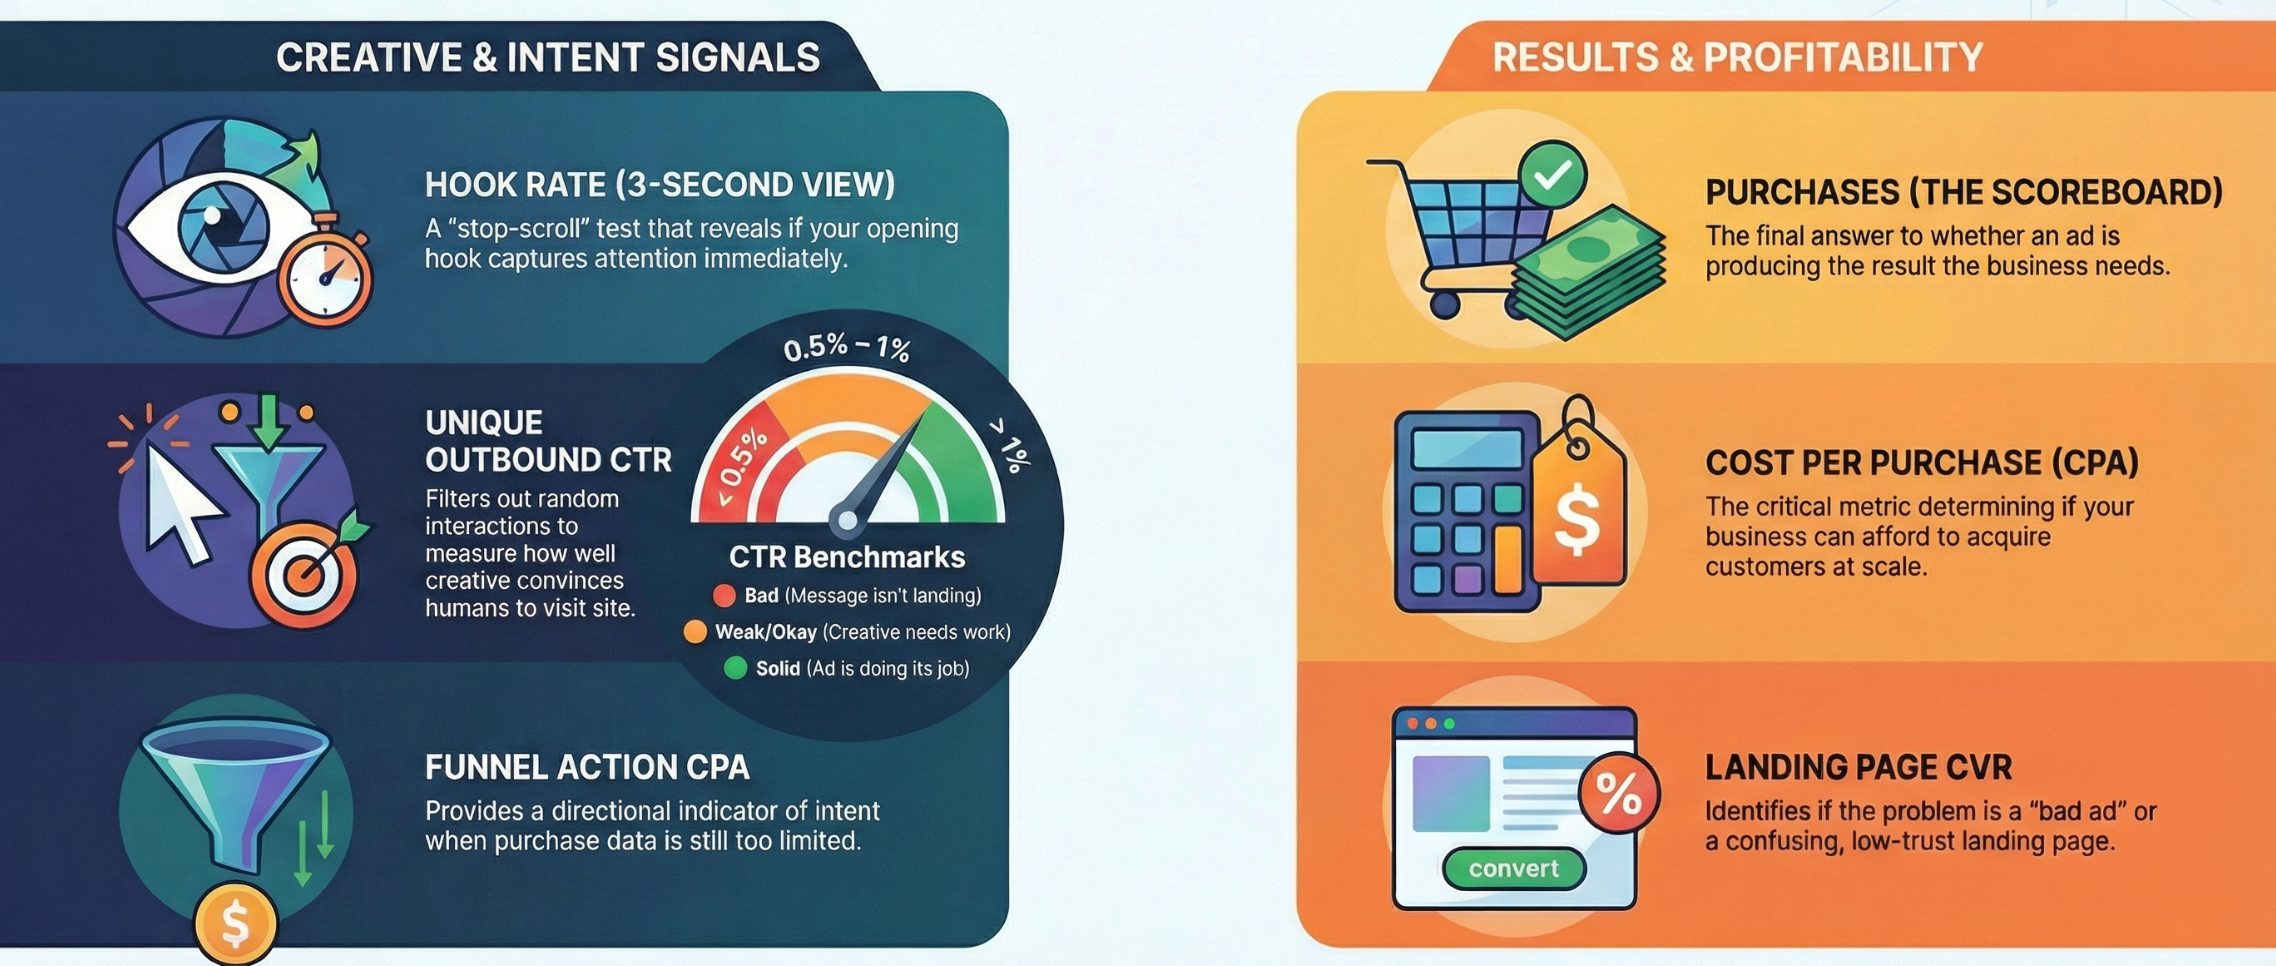
1) Purchases / Conversions
This is the scoreboard. Not clicks. Not comments. Not “traffic.”
If you’re running purchase campaigns, this is the metric that answers:
“Is this ad producing the result my business actually needs?”
No conversions = no proof yet. Everything else is just signals.
2) Cost per Purchase (CPA / CAC)
Getting purchases is great… until they’re too expensive.
This metric answers the only question that matters:
“Can I afford to acquire customers at this price?”
Example:
- You spend $500
- You get 2 purchases
- Your cost per purchase is $250
Then the real question becomes:
If every customer costs $250, does my business survive?
3) Conversion Rate (CVR) on the Landing Page
This is where a lot of “bad ads” get blamed for a bad page.
If people click but don’t convert, your ad might be fine.
Your landing page might be the problem.
CVR answers:
“When people arrive, do they understand and take the next step?”
Low CVR usually means:
- unclear value (“what is this?”)
- weak proof (no trust)
- too much friction (too many steps)
- mismatch between ad promise and page reality
4) Your Main Funnel Action (Add-to-Cart / Lead / Trial Starts)
You need one primary “step before purchase” to track—based on your business.
- Ecom: Add to Cart
- SaaS: Trial Starts / Sign-ups
- Lead gen: Qualified leads
This metric is a signal:
“Are people showing intent… or just browsing?”
It’s not the final goal, but it tells you if your funnel is moving.
5) Cost per Action (CPA) for That Funnel Step
Now pair the funnel action with its cost.
This answers:
“Am I buying the right kind of traffic at a price that makes sense?”
This is especially useful early, when purchases are still too few to judge confidently.
But remember: actions don’t pay bills—customers do.
So you use CPA as a directional indicator, not a victory lap.
6) Unique Outbound CTR (not regular CTR)
Regular CTR can lie because it includes random interactions:
- expanding captions
- clicking the profile
- tapping the image
Unique outbound CTR focuses on what you actually care about:
people leaving Meta and visiting your site.
This metric answers:
“Is this creative convincing real humans to take the next step?”
Simple benchmarks:
- < 0.5% = bad (message isn’t landing)
- 0.5%–1% = weak/okay (needs work)
- > 1% = solid (the ad is doing its job)
7) Hook Rate (3-second view rate)
Hook rate is your “stop-scroll” test.
It answers:
“Do people care in the first 2–3 seconds?”
If hook rate is low, don’t overthink targeting.
Your opening is the problem.
The best part: when you find a hook that works, you can reuse it in multiple variations:
- new angles
- new offers
- new scripts
- new formats
That’s how you build winners faster.
8) Frequency
Frequency tells you when performance drops because people are tired.
High frequency usually means:
- your audience is too small
- your creative isn’t refreshed
- Meta is stuck in one “bucket”
This metric answers:
“Am I scaling… or am I annoying the same people?”
When frequency climbs and results decline, it’s usually time to refresh creative (not panic-change everything).
How to Use the 8 Metrics
The easiest way to stay sane is to think in layers. Not all metrics are equal, and you shouldn’t treat them like they are.
The metrics ladder (the order that actually makes sense)
Level 1: Business outcomes
Start here because this is the truth. Purchases tell you if the campaign is producing real results. Cost per purchase (CAC/CPA) tells you if those results are sustainable.
If you only check two things, check these.
Level 2: Funnel signals
If purchases are low (which is normal early), look at your primary funnel action and its cost. For ecom that’s often add-to-cart. For SaaS it’s trials or sign-ups. This layer tells you whether people are moving forward with intent, or just visiting and leaving.
This is also where you stop confusing “activity” with progress. Actions are a useful signal, but purchases are the goal.
Level 3: Creative signals
Now you diagnose the ad itself. Hook rate tells you if the first seconds are doing their job. Unique outbound CTR tells you if the message is strong enough to send people to your site.
If these two are weak, your problem is usually creative, not the algorithm.
Level 4: Fatigue and efficiency
Frequency is your early warning system. If frequency climbs and results start slipping, your audience is getting tired. That’s usually a creative refresh problem, not a “new targeting hack” problem.
The only decisions you’re making daily
Once you view metrics like this, your job becomes simple. Every day you’re making one of four calls:
Scale when purchases are coming in and CAC is at (or close to) your target. If it’s slightly above target but trending down, you can still keep it alive and let it stabilize.
Pause when it’s clearly not working and it’s far from your target. Not “a bit worse than ideal.” Far.
Refresh when hook rate or unique outbound CTR is weak, or when frequency is climbing and performance is fading. You’re not rebuilding the whole campaign, you’re swapping what people see.
Fix the funnel when clicks are solid but conversions aren’t happening. That’s usually a landing page, offer, pricing, proof, or friction problem.
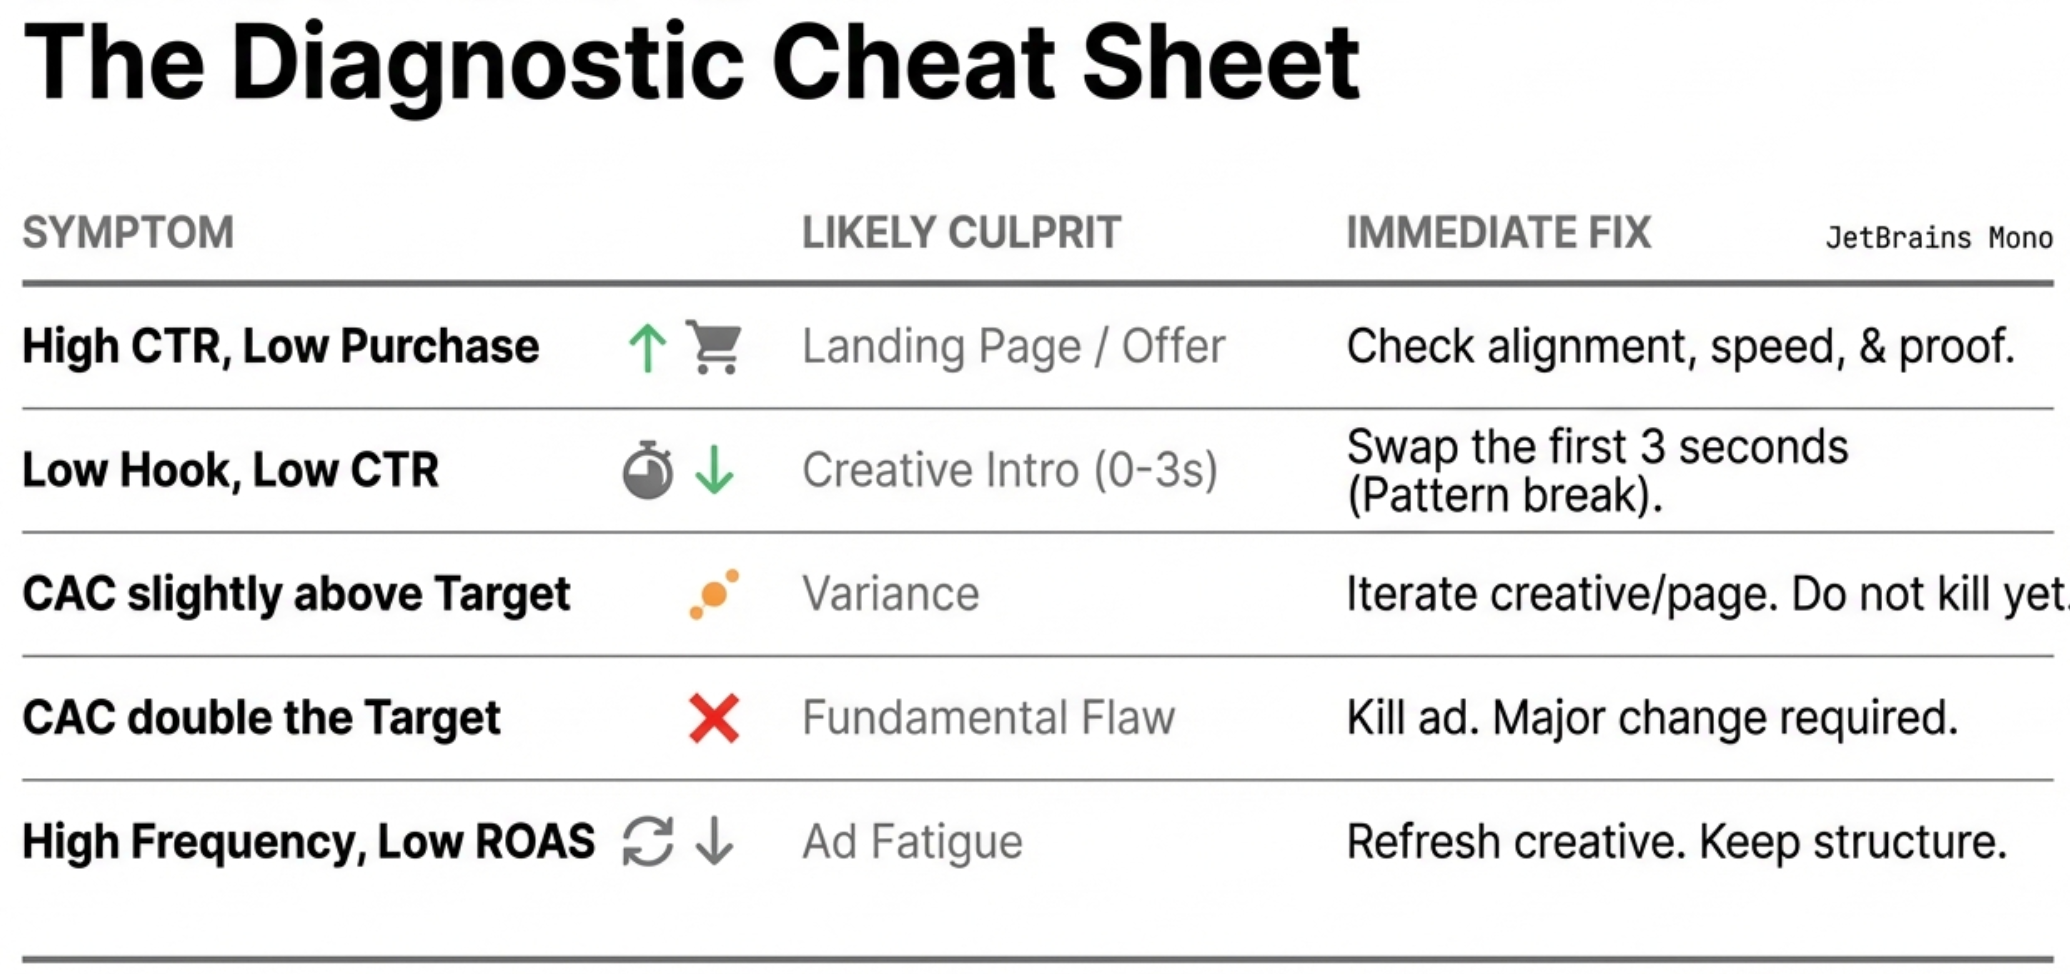
The Simple Diagnosis Framework (So You Stop Blaming the Wrong Thing)
Most ad accounts don’t fail because people “don’t know ads.” They fail because they diagnose the wrong problem.
They see no sales and instantly blame the creative.
Or they see high CPMs and blame the algorithm.
Or they see “good engagement” and assume it’s working.
Here’s a cleaner way to troubleshoot, using the 8 metrics you already have.
Scenario 1: Unique outbound CTR is good, but purchases are bad
This is the most common situation where ads get unfairly blamed.
If people are clicking, your message is doing its job. They understood the promise enough to leave the platform. The problem is usually what happens after the click.
Look next at landing page conversion rate and your funnel action (add-to-cart, trial starts, lead). If those are weak, the issue is almost always one of these:
Your page doesn’t match the ad’s promise.
Your value isn’t clear fast enough.
Your offer feels risky because there’s no proof.
Or there’s too much friction, too many steps, too much reading, too much thinking.
In other words: the ad is bringing attention. The funnel isn’t converting it.
Scenario 2: Hook rate is low, so Unique outbound CTR is low
This is a creative problem, not a “targeting” problem.
If people don’t stay for the first 2–3 seconds, they’ll never reach the part where you explain the value. That means the platform doesn’t get enough signal, your CTR stays weak, and you end up paying to show an ad nobody watches.
The fix is not to rebuild everything. It’s to swap the opening.
Same product. Same offer. Same angle.
Just a stronger first line, a more visual first frame, or a sharper “pattern break.”
When hook rate improves, outbound CTR usually follows.
Scenario 3: Purchases are coming in, but CAC is too high
This is where most beginners either panic or overcorrect.
First, compare CAC to your target. Not emotionally, mathematically.
If your target CAC is $250 and you’re at $500, you’re not “a little off.” You’re too far away. That’s usually a kill or a major change.
But if your target is $250 and you’re at $300, you’re close. That’s a candidate for iteration, not execution. Improve the creative, reduce friction on the page, or let the system stabilize before you make big moves.
The key mindset is simple: distance from the target matters more than being perfect immediately.
Scenario 4: Frequency is rising and performance is dropping
This isn’t mysterious. It’s fatigue.
Meta is showing your ad to the same people repeatedly, and they’ve already made up their mind. Some ignore it. Some get annoyed. Results slide.
When frequency goes up and your outbound CTR and purchases drop, the fix is usually to refresh creative. New hook, new angle, new variation. Not a full account restructure.
How Long Should You Let Ads Run Before Judging?
There’s no perfect rule, because budgets, audiences, and offers are all different.
But there is a correct mindset: Meta needs time + spend to learn. If you judge results too early, you don’t just make bad decisions, you train your account into chaos by constantly restarting the learning process.
Why 24-hour panic is expensive
The first day is noisy. You might get clicks but no purchases. You might get one purchase at a terrible CAC. You might get nothing and assume the ad is dead.
Most of the time, that’s not “truth.” That’s just early volatility.
What you want is enough delivery for the system to find patterns and for you to see whether the metrics are moving in the right direction.
A practical baseline that works for most brands
As a simple default, give a new creative about 7 days or enough spend to make the result meaningful for your business. UGC Ads can simplify this entire process if you work with the proper platform.
A common benchmark is roughly $100–$250 per creative (depending on what you can afford and what a conversion costs in your niche). The exact number matters less than the principle: you need enough spend to get signal, not vibes.
And yes, sometimes you’ll lose money at the start. That’s normal, especially when you’re still learning which hooks, angles, and offers your audience responds to.
When you should cut earlier
You don’t have to wait a full week if the ad is clearly “too far away.”
If your target CAC is $250 and you’re trending at $500 with no signs of improvement, you’re not being patient—you’re donating budget.
But if you’re close to target, or your creative signals are strong (good hook rate, solid unique outbound CTR) and the funnel signals are starting to move, it’s usually smarter to iterate than to kill.
The clean rule
Don’t ask: “Is this perfect yet?”
Ask: “Is this getting closer to the target, or drifting further away?”
A Quick 5-Minute Daily Metrics Routine (for busy teams)
This routine keeps you focused on decisions, not dashboards. Same order every day, so you don’t get pulled into random metrics.
Step 1: Check Purchases + Cost per Purchase
Start with reality. How many conversions did you get, and what did they cost?
If purchases are coming in and CAC is on target (or close), you’re in a good place. If purchases are flat, don’t panic—move down the ladder.
Step 2: Check Unique Outbound CTR
Now ask: are people actually clicking through to the site?
If unique outbound CTR is weak, your creative isn’t doing its job. No need to overanalyze the funnel yet, fix the message first.
If it’s solid, the ad is doing its part. Go deeper.
Step 3: Check Your Primary Funnel Action + Cost per Action
Look at the one key step that signals intent (add-to-cart, trial start, lead) and what it costs.
If you’re getting traffic but no funnel action, that’s usually a landing page/offer issue, or a mismatch between ad promise and page.
If the funnel action is happening at a reasonable cost, you’re building momentum—even if purchases lag behind early.
Step 4: Check Hook Rate (3-second view rate)
This is your creative quality check.
If hook rate is low, your first seconds aren’t landing, and your CTR will almost always struggle next. The fix is usually simple: swap the opening, tighten the first line, make the first frame more visual, and keep the rest of the ad concept intact.
If hook rate is strong, you’ve got a format worth repeating.
Step 5: Check Frequency (fatigue)
Finally, look for creative fatigue.
If frequency is climbing and results are falling, don’t immediately change targeting or rebuild campaigns. Refresh what people see. New hook, new variation, new angle. Keep the structure, keep the learnings.
What decision do you make after the routine?
At the end of five minutes, you should be able to pick one:
- Scale when purchases are coming in and CAC is close to target.
- Refresh when hook rate or unique outbound CTR is weak, or when frequency is rising.
- Fix the funnel when clicks are solid but people aren’t taking the next step on the page.
- Pause when CAC is far from target and the signals aren’t improving.
How Clip Helps You Improve the Creative Metrics (Hook + Unique Outbound CTR)
Once you start watching hook rate and unique outbound CTR, you realize something: most “ad problems” are really just iteration problems.
You don’t need one perfect video. You need a system that helps you produce the next 10 variations fast, because performance comes from patterns, not miracles.
That’s where Clip fits naturally into the workflow.
1) Turn “good hooks” into repeatable winners
When you find a hook that holds attention (your 3-second view rate jumps), that hook becomes an asset.
Instead of moving on and reinventing everything, Clip helps you build variations around what’s already proven:
same hook, different angle
same hook, different claim
same hook, different proof
same hook, different offer
That’s how you scale what works without burning out your creative team, or your brain.
2) Make CTR improvements a creative process, not a guessing game
Unique outbound CTR is basically a “message test.”
If it’s weak, it usually means one of these:
the promise isn’t clear
the concept feels generic
the payoff isn’t worth the click
the ad doesn’t feel specific enough
With Clip, you can generate and test cleaner versions of the same idea faster, so you’re not stuck debating what to change. You just ship iterations and let the metric tell you the truth.
3) Keep your creative testing organized by what matters
Most brands test random videos. Then a winner appears… and nobody knows why.
A better approach is to test with structure: hook → angle → offer → proof.
Clip makes it easier to build that loop consistently, so you can answer:
Which hooks consistently stop the scroll?
Which angles drive the highest outbound CTR?
Which claims bring the lowest CAC when paired with the right landing page?
Over time, you stop “trying ads” and start building a predictable creative engine.
4) Build the simplest loop that actually scales
Here’s the loop you want running every week:
Measure: hook rate + unique outbound CTR + CAC
Create: 5–10 variations based on what’s working
Ship: let ads run long enough to get signal
Decide: scale, refresh, fix funnel, or pause
Clip helps with the part most teams struggle with: creating enough quality variations to keep learning without stalling.
Quick closing
Metrics don’t just tell you what happened. They tell you what to do next.
If you track these 8 metrics, you’ll never feel “lost” in ads again, you’ll always know whether to change the creative, fix the funnel, scale a winner, or cut a loser.
And if you want to move faster on the creative side, Clip helps you turn those metric insights into new iterations, without starting from scratch every time.
Table of contents
- The Only 8 Metrics That Actually Guide Decisions
- How to Use the 8 Metrics
- The Simple Diagnosis Framework (So You Stop Blaming the Wrong Thing)
- How Long Should You Let Ads Run Before Judging?
- A Quick 5-Minute Daily Metrics Routine (for busy teams)
- How Clip Helps You Improve the Creative Metrics (Hook + Unique Outbound CTR)